Bespoke Investment Groupより、2件ほど紹介、
下記は84ヶ国の株式指数の2008年度成果、
緑がプラス圏、以下色別に、赤が-50%よりダウン、
黒の枠組みはG7、薄青がBRIC、
we provide 2008 performance numbers for the major equity indices of 84 countries. As shown, 32 of the 84 countries were down more than 50% in 2008, while just three countries finished in the green -- Ghana, Tunisia, and Ecuador. Iceland was down by far the most, losing nearly all of its value at with a decline of 94.43%. Of the G-7 countries, the UK did the best with a loss of 31.33%, followed by Canada (-35%), and the US (-38.5%). With a decline of 48.4%, Italy was the weakest of the G-7 countries. At the start of 2008, the decoupling trade was all the rage, as emerging markets such as Brazil, Russia, India, and China (BRIC) were supposed to hang in there much better due to continued growth prospects. When all was said and done though, of the BRIC countries, only Brazil did better than any of the G-7 countries, while India, China, and Russia were all down more than 50%.
84ヶ国中、34ヶ国が50%以上のダウン、
これだけ世界的に広範囲にダメージを受けると、復帰は時間がかかりそうだというのが見えてくる、
なぜかガーナが+58%のトップ、(理由はなんだろう?)
G7では英国がトップ、イタリアが下位、
BRICでブラジルの健闘が目立つところか、
BRICのDJとの比較チャートを下記に、
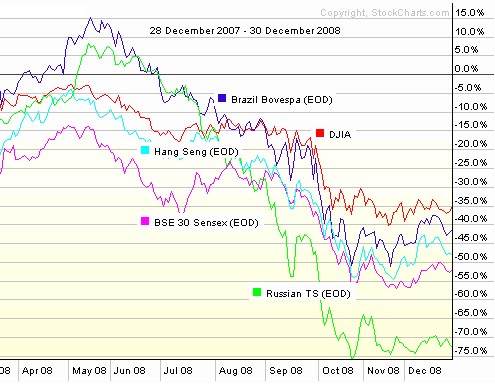

やはり、ロシアの-72%は目立つ、
(ロシアはなんか対策を打たんといかんかも、)
次、Gold/Silver、
The first two charts below are our trading range charts for gold and silver. The green shading represents two standard deviations above and below the commodity's 50-day moving average. When the price moves to the top or above the trading range, the commodity is considered overbought (and oversold for moves below). As shown, both gold and silver are currently trading right right at overbought territory based on their historical trading patterns.
下記は上限が買われすぎ、下限が売られすぎの領域をあらわす、ゴールド、シルバー共、現在、買われ過ぎとなっている、

However, gold has been significantly outperforming silver since the middle of 2008. In the third chart, we highlight the ratio of gold to silver (gold divided by silver). A declining line means silver is outperforming gold, while a rising line means gold is outperforming. Since June 2008, the line has pretty much gone straight up, as almost all commodities except for gold have seen big declines due to deleveraging, the bursting of the speculative commodity bubble, and the global economic downturn. Based on the ratio of gold to silver over the last ten years, a reversion of the mean trade would be to go long silver and short gold.
しかし、G/S比で過去10年を見ると、ゴールドがシルバーより買われすぎており、 G/S比で見る限り、ゴールド売りのシルバー買いとなる、

松藤さん含め、巷ではゴールドは2000ドルも行くのではと言われているが、古典的指標であるGS比を見るなら、ゴールドは売りというのが面白い、
こちらに直近のG/S比チャート(Weekly)を、
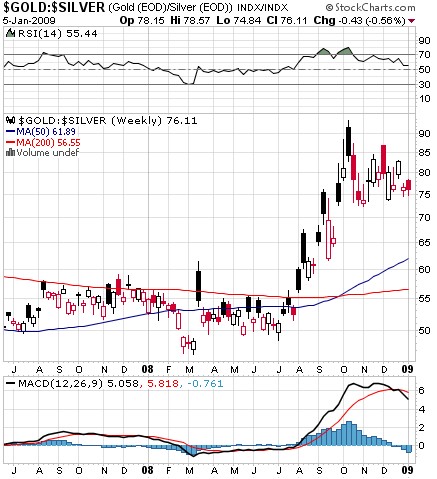
GSR & RSI
依然として、高値領域だが、フラグを形成しているので今後の動きに注意か、