pydot でカレンダーを作る (1) を作るの続き。とりあえずの枠組みができたので、今度は、ダミーだったカレンダーの中身を作る。Python には標準モジュールでカレンダーに関する関数があるのでこれを使うことにする。
5.18 calendar -- 一般的なカレンダーに関する関数群 Python ライブラリリファレンス。
monthcalendar(year, month) を使えば、一発でカレンダーの行列が得られる。
>>>import calendar

>>>calendar.monthcalendar(2007,11)

[[0, 0, 0, 1, 2, 3, 4],

 [5, 6, 7, 8, 9, 10, 11],

 [12, 13, 14, 15, 16, 17, 18],

 [19, 20, 21, 22, 23, 24, 25],

 [26, 27, 28, 29, 30, 0, 0]]
よく見ると、月曜日から始まっている。次のように日曜から始まっているリストが欲しい。これは calendar.setfirstweekday(calendar.SUNDAY) と実行すればよい。
$ cal 11 2007

   11月 2007

 S  M Tu  W Th  F  S

             1  2  3

 4  5  6  7  8  9 10

11 12 13 14 15 16 17

18 19 20 21 22 23 24

25 26 27 28 29 30
カレンダーは、数字ではなくて、文字列にしておきたいので、まとめて文字列に変換して、曜日のリストと一緒にして、表示用のノードリストとする。month(year, month) を使えば文字列として、「 November 2007\nSu Mo Tu We Th Fr Sa\n 1 2 3\n 4 5 6 7 8 9 10\n11 12 13 14 15 16 17\n18 19 20 21 22 23 24\n25 26 27 28 29 30\n'」のような結果が得られるので、これをばらしてもいいが。
import calendar


year = 2007

month = 11

week = [u'日',u'月',u'火',u'水',u'木', u'金', u'土']


# 日曜から始めたい。これで日曜から始まる

calendar.setfirstweekday(calendar.SUNDAY)

caldata = calendar.monthcalendar(year, month)


# 文字列にまとめて変換

node_list = [[str(x) for x  in y] for y in caldata]


# 曜日を先頭に追加

node_list.insert(0, week)
これを前のプログラムの前の方に入れると、次のようなグラフになってしまう。
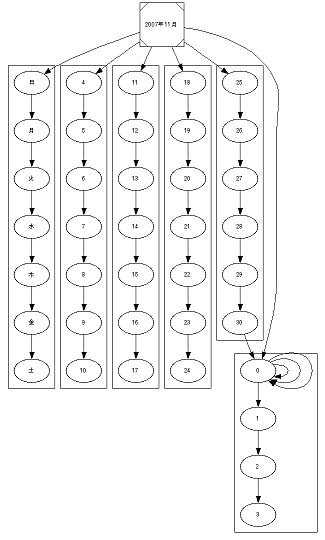
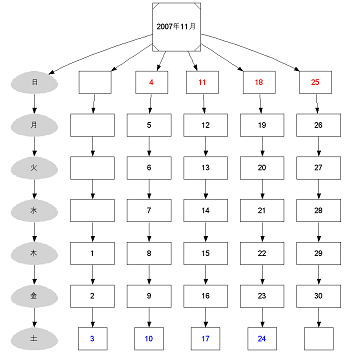
カレンダーの最初の方と最後の方に 0 があるから、それを律儀に繋いでくれた。まあ、当たり前といえばあたりまえのことであった。ということで、この手の、表面上同じ値であったも、別の実体としてそれぞれを扱いたいときには、ノード名をユニークにして、ラベルで値を付けるということをしないといけないので書き直す。ノードはユニークな値をつけなきゃいけない。0 が表示されるのも変なので、これは空白文字にする。ついでなので属性も付ける。
ちなみに year と month は直書きしてあるが、import sys; year = sys.argv[1]; month = sys.argv[1] に変えれば、コマンドラインから指定できるようになるので、だいたい例題と同じような感じのものができたかな。
#!/usr/bin/env python

#-*- coding: utf-8 -*-


from pydot import Dot, Cluster, Node, Edge

import calendar


# カレンダーを作ってノードリストとする。

year = 2007

month = 11

head_name = "%d年%d月" % (year, month)


week = [u'日',u'月',u'火',u'水',u'木', u'金', u'土']

calendar.setfirstweekday(calendar.SUNDAY)

caldata = calendar.monthcalendar(year, month)


# 0 は表示したくないのでスペースに変換し、すべて文字列に変換。

def to_str(s):

   if s == 0:

      return " "

   else:

      return str(s)

node_list = [[to_str(x) for x  in y] for y in caldata]

node_list.insert(0, week)


# 属性設定用の関数

def set_node_attr(node, label, dayofweek, subgnum):

    node.set_label(label)

    if subgnum == 0:

        node.set_fontname("arialuni.ttf")

        node.set_fontcolor("black")

        node.set_color("lightgray")

        node.set_shape("egg")

        node.set_style("filled")

        node.set_width(1.15)

        node.set_height(.60)

    else:

        node.set_fontname("arialuni.ttf")

        node.set_color("black")

        node.set_shape("box")

        node.set_style("solid")

        node.set_height(.60)

        if dayofweek == 0:  # 日曜

            node.set_fontcolor("red")

            node.set_width(.85)

        elif dayofweek == 6:  # 土曜

            node.set_fontcolor("blue")

            node.set_width(.75)

        else:

            node.set_fontcolor("black")

            node.set_width(1.15)


# グラフを用意する

g = Dot()

n = Node('node')

n.set_fontname('arialuni.ttf')

n.set_fontsize(14)

n.set_style('solid')

g.add_node(n)


# ヘッドを追加する

n = Node('head')

n.set_label(head_name)

n.set_shape('Msquare')

g.add_node(n)


# 列ごとにサブグラフを作る。

cluster = {}

node_id = 0

for subgnum, nodes in enumerate(node_list):


    # サブグラフの名前を指定して、サブグラフを生成。

    name = 'sub_%d' % subgnum

    cluster[subgnum] = Cluster(graph_name=name)

    c = cluster[subgnum]


    # [1,2,3..] を [2,3,4,...] と合わせて、

    # (1,2),(2,3),(3,4) というエッジを生成

    edges = zip(nodes, nodes[1:])

    edge_list = []

    for dayofweek, label in enumerate(edges):


        # ノード名を付けて、エッジを生成

        e1 = "day%d" % node_id

        node_id += 1

        e2 = "day%d" % node_id

        c.add_edge(Edge(e1, e2))


        # 自動作成されたノードに属性を設定する

        n = c.get_node(e1)

        set_node_attr(n, label[0], dayofweek, subgnum)

        n = c.get_node(e2)

        dayofweek = dayofweek + 1

        set_node_attr(n, label[1], dayofweek, subgnum)


    # 一つのサブグラフが終了したら、次のグラフの中の要素と

    # つながらないように id を増やす

    node_id += 1


    # 先頭のノードをヘッドにつなぐ

    c.set_color('white')

    n = c.get_node_list()[0]

    g.add_edge(Edge('head', n.name))


    # クラスタをメインのグラフに追加する

    g.add_subgraph(cluster[subgnum])


g.write_png('calendar.png')