|
|
|
|
2017年05月27日
カテゴリ:プログラミング
振動・騒音解析業務では、数多くの周波数応答関数(Frequency Response Function)を描く。
入力点x方向(x,y,z)x応答点x方向x,y,z)で、何百という数になる。 そこで、matplotlibで9枚のグラフを描画するコードを描いてみた。 ここではグラフの枠だけ。中身は好きに埋めてください。ax[i].plot(x,y)で。 In [19]: import matplotlib.pyplot as plt In [20]: fig=plt.figure(figsize=(8,6)) In [21]: ax=range(18) In [22]: ax[0]=fig.add_axes((0.1,0.9,0.25,0.05)) ...: ax[1]=fig.add_axes((0.1,0.7,0.25,0.18)) ...: ax[2]=fig.add_axes((0.4,0.9,0.25,0.05)) ...: ax[3]=fig.add_axes((0.4,0.7,0.25,0.18)) ...: ax[4]=fig.add_axes((0.7,0.9,0.25,0.05)) ...: ax[5]=fig.add_axes((0.7,0.7,0.25,0.18)) ...: ax[6]=fig.add_axes((0.1,0.6,0.25,0.05)) ...: ax[7]=fig.add_axes((0.1,0.4,0.25,0.18)) ...: ax[8]=fig.add_axes((0.4,0.6,0.25,0.05)) ...: ax[9]=fig.add_axes((0.4,0.4,0.25,0.18)) ...: ax[10]=fig.add_axes((0.7,0.6,0.25,0.05)) ...: ax[11]=fig.add_axes((0.7,0.4,0.25,0.18)) ...: ax[12]=fig.add_axes((0.1,0.3,0.25,0.05)) ...: ax[13]=fig.add_axes((0.1,0.1,0.25,0.18)) ...: ax[14]=fig.add_axes((0.4,0.3,0.25,0.05)) ...: ax[15]=fig.add_axes((0.4,0.1,0.25,0.18)) ...: ax[16]=fig.add_axes((0.7,0.3,0.25,0.05)) ...: ax[17]=fig.add_axes((0.7,0.1,0.25,0.18)) ...: In [23]: for i in range(18): ...: ax[i].set_xlim(10,200) ...: ax[i].set_xlabel("Frequency [Hz]") ...: ax[i].grid() ...: if i%2==0: ...: ax[i].set_ylabel("Phase [deg]") ...: ax[i].set_ylim(0,360) ...: if i%2==1: ...: ax[i].set_ylabel("Magunitude [db]") ...: ax[i].set_ylim(0,100) ...: In [24]: plt.show() 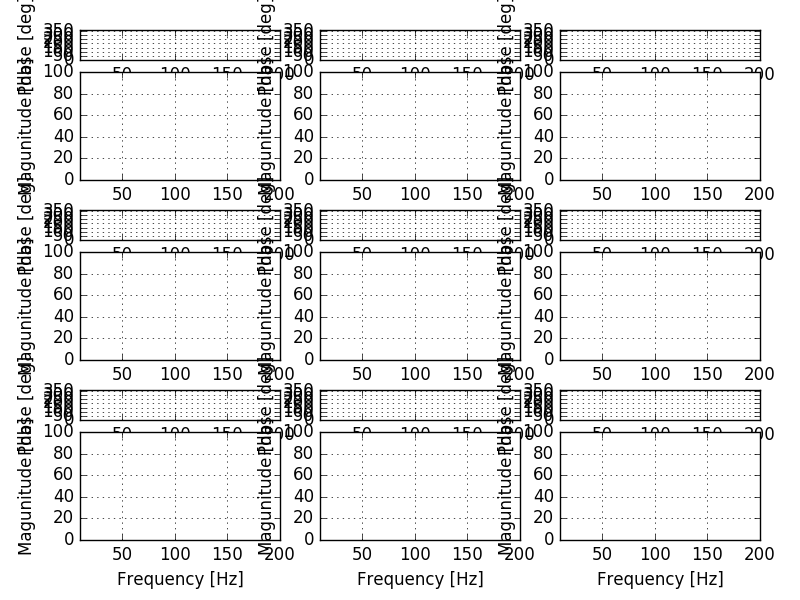 大量のグラフを描かなきゃならないとき、ほんと、matplotlibは助かる。 ----- I draw numerous graphs in NVH analysis. The number is input points by the direction (x,y,z) by respons points by the direction (x,y,z). I coded the drawing 9 graphs script with matplotlib. I show only the graph frame. Please fill your graph with ax[i].plot(x,y). Matplotlib helps me a lot when drawing numerous graphs. にほんブログ村 お気に入りの記事を「いいね!」で応援しよう
最終更新日
2017年05月27日 20時39分31秒
コメント(0) | コメントを書く
[プログラミング] カテゴリの最新記事
|