Python から Graphviz を使う( pydot を日本語で出力)(5) の続き。
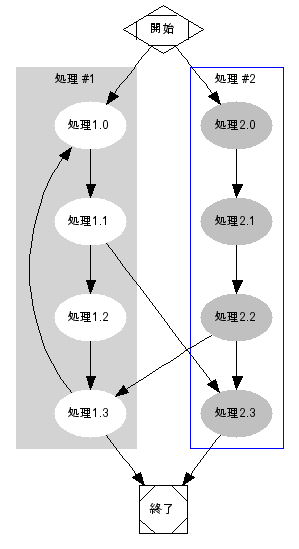
pydot でまだサブグラフを描いていなかったので試してみることにする。まずは、第一の目標として、下のようなグラフを生成することにする。枠でくくられた 2 つがサブグラフになっている。
まずはサブグラフを使わないとどうなるか試す。日本語対応させた graph_from_edges2 を使って描いてみる(フォントを指定し直すのが面倒なので、デフォルトで日本語のフォントを指定するようにしてある)。
#!/usr/bin/env python

# -*- coding: utf-8 -*-


import pydot


egdges = [

        (u"開始",  u"処理1.0"),

        (u"処理1.0", u"処理1.1"),

        (u"処理1.1",  u"処理1.2"),

        (u"処理1.2",  u"処理1.3"),

        (u"処理1.3",  u"終了"),


        (u"開始",  u"処理2.0"),

        (u"処理2.0", u"処理2.1"),

        (u"処理2.1", u"処理2.2"),

        (u"処理2.2", u"処理2.3"),

        (u"処理2.3", u"終了"),


        (u"処理1.1", u"処理2.3"),

        (u"処理1.3", u"処理1.0"),

        (u"処理2.2", u"処理1.3"),

        ]


g = pydot.graph_from_edges2(egdges, directed=True)


# ノードの形の変更 (開始, 終了, その他)

for node in g.get_node_list():

    if node.name == u"開始":

        node.shape = "Mdiamond"


    elif node.name == u"終了":

        node.shape = "Msquare"


g.write_png('subgraph1.png')
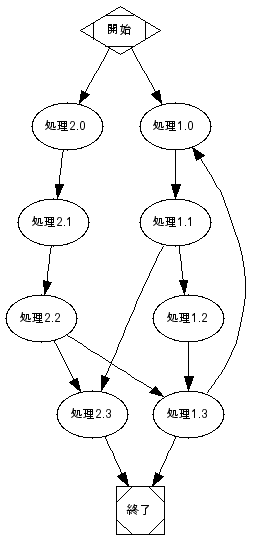
すると、こんな感じになる。1.0 と 2.0 が左右反転してしまっているが、とりあえず気にしないでおく。
でもって、枠で囲われたところはサブグラフにしたいので、処理1.0 ~ 処理1.3、処理2.0 ~処理2.3 のところをまずリストから省く。そして、独立したサブグラフを作ってやって、追加すればよいかなという方針を立てる。
ところが、サブグラフをリストから作るような関数が用意されていない。そこで、graph_from_edges のようなものを作って、リストからまとめて追加できるようにすればよいかな。ということで、ほとんど graph_from_edges と同じような cluster_from_edges と cluster_from_edges2 を作った。とりあえず、動作が確認できればいいやという感じ。試行錯誤でやったのでかなり泥臭い。
もっと汎用的に書き直したくなってきた。属性などはリストにしておいて、制御できるようにして、まとめて設定できるような仕組みが欲しい。加えて、サブグラフがいくつあっても動くようにすれば、それなりに有用なものになるかもしれない。一通り試し終わったら、pydot 自体を見直して、まとめて属性を設定しやすいように、あるいは何らかの基準で自動設定できるように改造するというのも、ありかもしれない。
#!/usr/bin/env python
# -*- coding: utf-8 -*-
import pydot
egdges = [
(u"開始", u"処理1.0"),
(u"処理1.3", u"終了"),
(u"開始", u"処理2.0"),
(u"処理2.3", u"終了"),
(u"処理1.1", u"処理2.3"),
(u"処理2.2", u"処理1.3"),
(u"処理1.3", u"処理1.0"),
]
sub1 = [(u"処理1.0", u"処理1.1"),
(u"処理1.1", u"処理1.2"),
(u"処理1.2", u"処理1.3"),]
sub2 = [(u"処理2.0", u"処理2.1"),
(u"処理2.1", u"処理2.2"),
(u"処理2.2", u"処理2.3"),]
def cluster_from_edges(edge_list, node_prefix='', directed=False):
"""Creates a Cluster out of an edge list.
The edge list has to be a list of tuples representing
the nodes connected by the edge.
The values can be anything: bool, int, float, str.
If the cluster is undirected by default, it is only
calculated from one of the symmetric halves of the matrix.
"""
if directed:
cluster = pydot.Cluster(graph_type='subdigraph')
else:
cluster = pydot.Cluster(graph_type='subgraph')
for edge in edge_list:
e = pydot.Edge(node_prefix+str(edge[0]), node_prefix+str(edge[1]))
cluster.add_edge(e)
return cluster
def cluster_from_edges2(edge_list, directed=False, node_prefix='', node_attrs={}):
"""
cluster_from_edge でサブグラフを作成してから、
指定された属性またはデフォルト属性を持つノードを追加する。
"""
cluster = cluster_from_edges(edge_list, node_prefix, directed)
cluster.set_fontname('arialuni.ttf')
cluster.set_fontsize(9)
if node_attrs == {}:
node_attrs = pydot.DEFAULT_NODE_ATTRS
# 属性用にノードを作って、属性を反映する。
node = pydot.Node('node')
for n, v in node_attrs.items():
node.__setattr__(n, v)
# グラフのノードリストの先頭にに挿入する。
cluster.node_list.insert(0, node)
cluster.sorted_graph_elements.insert(0, node)
return cluster
# メインのグラフを作る
g = pydot.graph_from_edges2(egdges, directed=True)
# ノードの形の変更 (開始, 終了, その他)
for node in g.get_node_list():
if node.name == u"開始":
node.shape = "Mdiamond"
elif node.name == u"終了":
node.shape = "Msquare"
# クラスター(サブグラフ)を 2つ作って、属性を設定する。
cluster1 = cluster_from_edges2(sub1)
cluster1.set_name('cluster_sub01')
cluster1.set_style('filled')
cluster1.set_color('lightgrey')
cluster1.set_label(u"処理 #1")
for node in cluster1.get_node_list():
node.set_style('filled')
node.set_color('white')
print "here1"
cluster2 = cluster_from_edges2(sub2)
cluster2.set_name('cluster_sub02')
cluster2.set_color('blue')
cluster2.set_label(u"処理 #2")
for node in cluster2.get_node_list():
node.set_style('filled')
node.set_color('gray')
print "here2"
# メインのグラフにクラスターを追加する。
g.add_subgraph(cluster1)
g.add_subgraph(cluster2)
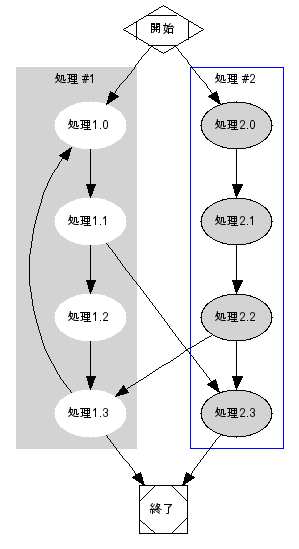
g.write_png('subgraph2.png')