RSI Has Been Falling
RSIは下落している
The Bitcoin (BTC) 7-day Relative Strength Index (RSI) is at 69, shy of the overbought marker yet not in oversold territory. This balance may hint at a decreasing interest in Bitcoin. This indicates a phase of consolidation where neither buying nor selling forces dominate.
ビットコイン (BTC)の7日間の相対力指数 (RSI)は69で、買われ過ぎのマーカーを恐れていますが、売られ過ぎの領域には入っていません。このバランスは、ビットコインへの関心の低下を示唆している可能性があります。これは、買いも売りも支配しない固まった段階を示します。
The RSI serves as a momentum gauge in technical analysis, assessing recent price fluctuations to determine if an asset is overbought (above 70) or oversold (below 30).
RSIはテクニカル分析の勢い計器として機能し、最近の価格変動を評価して、資産が買われ過ぎか(70以上) 売られ過ぎか(30未満) を判断します。
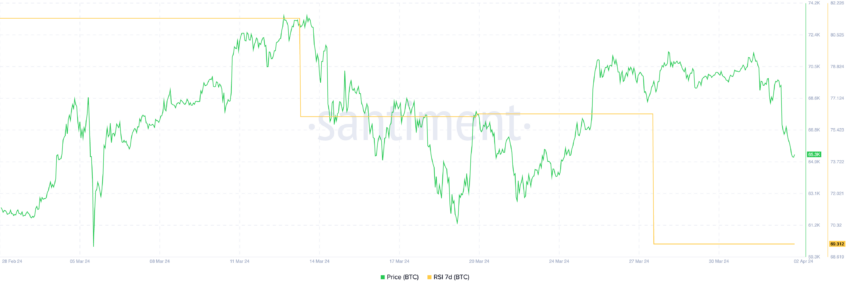
BTC RSI 7D. Source: Santiment. BTC RSI 7D. 出典: サンテイメント
This means that, at 69, Bitcoin is on the cusp of being considered overbought, but its stabilization in this neutral zone indicates a lack of momentum either way. Six days ago, the RSI dropped from 76 to 69 as BTC price began to stabilize in the $68,000 to $72,000 range.
これは、69で、ビットコインが買われ過ぎと見なされる寸前にあることを意味しますが、この中立ゾーンでの安定化は、どちらの方法でも勢いの欠如を示しています。6日前、BTC価格が68,000ドルから72,000ドルの範囲で安定し始めたため、RSIは76から69に低下しました。
This decrease from previously higher levels suggests a cooling off in the fervor around Bitcoin. The drop in RSI, coupled with price stabilization, can be seen as an indicator of declining interest or a collective pause among investors, potentially setting the stage for a shift in market dynamics if new buying or selling pressures do not emerge.
以前の高水準からのこの減少は、ビットコインをめぐる熱意の冷え込みを示唆しています。RSIの低下は、価格の安定と相まって、投資家の関心の低下または集団的な一時停止の指標と見なすことができ、新たな売買圧力が出現しない場合、市場のダイナミクスの変化の舞台となる可能性があります。
BTC Price Prediction: Falling Below $60k This Week?
BTC価格予測: 今週は$ 60kを下回る?
BTC Exponential Moving Average (EMA) lines are nearing a death cross, a pattern often seen as a bearish market signal. The death cross happens when the short-term moving average falls beneath the long-term average, indicating that recent momentum is waning compared to the broader trend. This shift suggests the market might be moving from bullish to bearish conditions.
BTC指数移動平均線 (EMA)は、弱気の市場シグナルとしてよく見られるパターンであるデスクロスに近づいています。デスクロスは、短期移動平均線が長期平均線を下回るときに発生し、最近の勢いが全体的なトレンドと比較して弱まっていることを示しています。この変化は、市場が強気から弱気の状況に移行している可能性があることを示唆しています。
Unlike simple moving averages, EMA lines prioritize recent price action to be more reactive to changes. They smooth price data over time, tracking price trends based on past performance to simplify market direction analysis. This method enhances the ability to discern the market’s path, making EMA lines crucial in technical analysis.
単純移動平均線とは異なり、EMAラインは最近の値動きを優先し、変化により反応します。時間の経過とともに価格データを平滑化し、過去のパフォーマンスに基づいて価格傾向を追跡して、市場の方向性分析を簡素化します。この方法は、市場の経路を識別する能力を高め、EMAラインをテクニカル分析で重要にします。
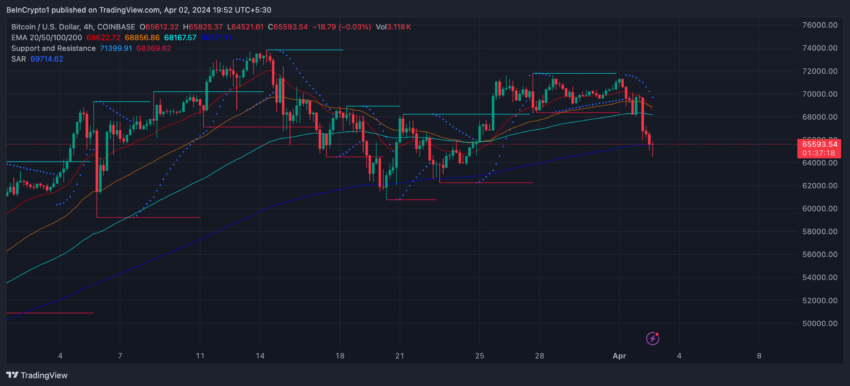
BTC 4H Price Chart and EMA Lines. Source: TradingView.
BTC 4H価格チャートとEMAライン。 出典: TradingView
Currently, if the bearish trend indicated by the nearing death cross continues, BTC’s price could drop to $59,200, especially if the $62,300 support level proves insufficient to hold the decline. This potential fall could reflect increased selling pressure and weakening market sentiment towards BTC.
現在、デスクロスが近づいていることが示す弱気トレンドが続く場合、BTCの価格は59,200ドルまで下落する可能性があります。この潜在的な下落は、売り圧力の高まりとBTCに対する市場センチメントの弱体化を反映している可能性があります。
Read More: Bitcoin Price Prediction 2024/2025/2030
続きを読む: ビットコイン価格予測2024/2025/2030
However, there’s also a possibility for a reversal of this trend. If buyers regain control and push the market into an uptrend, BTC could challenge the $71,700 resistance level. Overcoming this barrier would require significant buying pressure but could signal a renewed bullish sentiment and a potential reversal of the current bearish outlook.
しかし、この傾向が逆転する可能性もあります。買い手が主導権を取り戻し、市場を上昇トレンドに押し上げれば、BTCは71,700ドルのレジスタンスレベルに挑戦する可能性があります。この障壁を乗り越えるには、大きな買い圧力が必要ですが、強気のセンチメントが再燃し、現在の弱気な見通しが反転する可能性を示唆する可能性があります。
Best crypto platforms in Europe | April 2024
ヨーロッパで最高の仮想通貨プラットフォーム|2024年4月発売
YouHodlerExplore →
Wirex AppExplore →
CoinbaseExplore →
PrimeXBTExplore →
SunContractExplore →
Disclaimer
免責事項
In line with the Trust Project guidelines, this price analysis article is for informational purposes only and should not be considered financial or investment advice. BeInCrypto is committed to accurate, unbiased reporting, but market conditions are subject to change without notice. Always conduct your own research and consult with a professional before making any financial decisions. Please note that our Terms and Conditions, Privacy Policy, and Disclaimers have been updated.
Trust Projectのガイドラインに沿って、この価格分析の記事は情報提供のみを目的としており、金融または投資のアドバイスと見なされるべきではありません。BeInCryptoは正確で偏りのない報告をお約束しますが、市場の状況は予告なしに変更される場合があります。金融上の決定を下す前に、常に独自の調査を行い、専門家に相談してください。利用規約、プライバシーポリシー、免責事項が更新されました。
Tiago Amaral
READ FULL BIO
ティアゴ・アマラル
略歴全文を読む
Marketing professional turned coder, passionate about code, data, crypto, and writing. I hold a Marketing and Advertising degree and a Disruptive Strategy certification from Harvard Business School. I love querying blockchain data and discovering insights hidden in data.
マーケティングの専門家からコーダーに転身し、コード、データ、仮想通貨、執筆に情熱を注いでいます。ハーバード・ビジネス・スクールでマーケティングと広告の学位と破壊的戦略の資格を取得しています。ブロックチェーンデータを照会し、データに隠された洞察を発見するのが大好きです。
==============================
インターネット・コンピュータランキング
==============================
ネットサービスランキング
==============================


![[商品価格に関しましては、リンクが作成された時点と現時点で情報が変更されている場合がございます。]](https://hbb.afl.rakuten.co.jp/hgb/2af8ed00.3f53f5ca.2af8ed01.a129a7d9/?me_id=1193345&item_id=12695716&pc=https%3A%2F%2Fthumbnail.image.rakuten.co.jp%2F%400_mall%2Febest%2Fcabinet%2F526%2F4548736128521.jpg%3F_ex%3D240x240&s=240x240&t=picttext "[商品価格に関しましては、リンクが作成された時点と現時点で情報が変更されている場合がございます。]")

![[商品価格に関しましては、リンクが作成された時点と現時点で情報が変更されている場合がございます。]](https://hbb.afl.rakuten.co.jp/hgb/3afcad21.d25d717e.3afcad22.4edbcbd6/?me_id=1275709&item_id=10084838&pc=https%3A%2F%2Fthumbnail.image.rakuten.co.jp%2F%400_mall%2Fgorri%2Fcabinet%2Fkategoriyou-gazou%2Fkotatsu%2Fviel-k_thum-asu.jpg%3F_ex%3D240x240&s=240x240&t=picttext "[商品価格に関しましては、リンクが作成された時点と現時点で情報が変更されている場合がございます。]")
![[商品価格に関しましては、リンクが作成された時点と現時点で情報が変更されている場合がございます。]](https://hbb.afl.rakuten.co.jp/hgb/3afcae37.b40930b4.3afcae38.86b03f74/?me_id=1226290&item_id=10000056&pc=https%3A%2F%2Fthumbnail.image.rakuten.co.jp%2F%400_mall%2Fflowerkitchen%2Fcabinet%2Fpr%2F03322023%2F24hanahchi-05a_02.jpg%3F_ex%3D240x240&s=240x240&t=picttext "[商品価格に関しましては、リンクが作成された時点と現時点で情報が変更されている場合がございます。]")
![[商品価格に関しましては、リンクが作成された時点と現時点で情報が変更されている場合がございます。]](https://hbb.afl.rakuten.co.jp/hgb/3afcae7d.aa81fa48.3afcae7e.e70710ca/?me_id=1405250&item_id=10000032&pc=https%3A%2F%2Fthumbnail.image.rakuten.co.jp%2F%400_mall%2Fmixiofficial%2Fcabinet%2F10298640%2Fimgrc0077938058.jpg%3F_ex%3D240x240&s=240x240&t=picttext "[商品価格に関しましては、リンクが作成された時点と現時点で情報が変更されている場合がございます。]")
![[商品価格に関しましては、リンクが作成された時点と現時点で情報が変更されている場合がございます。]](https://hbb.afl.rakuten.co.jp/hgb/3afcaeb9.0e6d0618.3afcaeba.5c084c8e/?me_id=1371293&item_id=10000071&pc=https%3A%2F%2Fthumbnail.image.rakuten.co.jp%2F%400_mall%2Fsunshine-osaka%2Fcabinet%2F09337950%2Febi1000612.jpg%3F_ex%3D240x240&s=240x240&t=picttext "[商品価格に関しましては、リンクが作成された時点と現時点で情報が変更されている場合がございます。]")


